Test System Configuration
A very similar system similar to the one used in the NVIDIA GTX 660 Ti launch round up was assembled. The only thing changed out was the PSU (an Antec HCP-1000 unit) and will not affect our results.
- Processor: Intel Core i7-3770K Ivy Bridge
- Motherboard: ASUS ROG Maximus V Gene
- Memory: Kingston HyperX 2800MHz DDR3 @ 1600 CL8
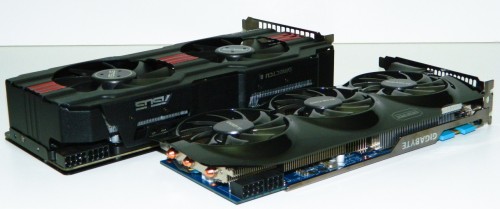
- Video card 1: ASUS AMD HD 7970 DirectCU II (as tested)
- Video card 2: EVGA GTX 660 Ti Superclocked
- Video card 3: GIGABYTE GTX 670 OC
- Video card 4: MSI GTX 560 Ti TwinFrozrII
- Video card 5: ZOTAC GTX 580 AMP!
- Power Supply: NZXT HALE82-N 750 W
- Cooling: NZXT HAVIK 140
- OS: Win 7 Pro 64-bit
Screen resolutions are set at 1920 x 1080p on an ASUS VG27H 3D monitor. Benchmark resolutions are in the graph details in the benchmarks. Power consumption was monitored using a Seasonic Power Angel with a minimum of 1 hr observation time. Fan noise was recorded using an Extech sound meter which has a limited 30dB lowest noise level detection. Therefore, fan noise was measured from 2 feet away so we could hear SOME difference. The latest AMD8_921_5WHQL from ASUS was used at first but we discovered AMD’s 12-8 Catalyst drivers offered better performance so definitely use those for your own card.
Overclocking the ASUS AMD HD 7970 DirectCU II
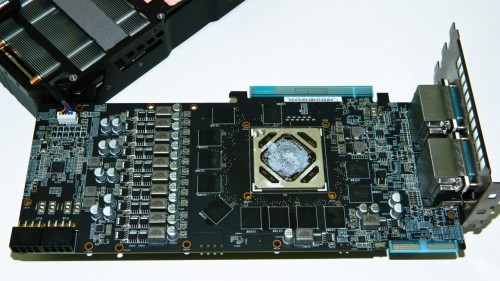
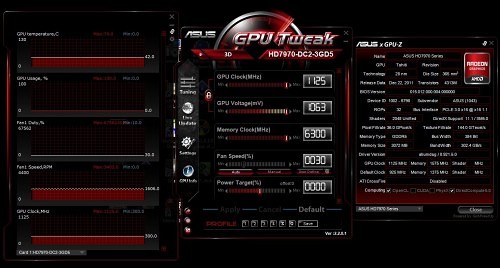
The single digit frame gains found in our NVIDIA’s GTX 660 Ti cards just don’t seem worth the risk. However, high end cards like the DirectCU II are built to satisfy overclocking enthusiasts. That formation of Super Alloy Power chokes and capacitors creating a 12-phase digital VRM for the GPU, hint to the epic possibilities. Essentially, the DIGI+VRM can do more with 28 amps versus lesser VRM with 34 amps. That said, here’s what we got using ASUS GPU Tweak and the AMD ATI control panel to overclock the card.
In both cases, the card out ran the overclocking utilities operating perfectly stable at maximum settings. The overclock netted about 14 frames extra which was a lot more than I could coax out of the previously reviewed NVIDIA cards. While you can go completely insane hoping for another 75MHz core frequency and a bit more memory frequency, most users are going to be just fine with this overclock for useable double digit gains.
Either way, the DirectCU II cooler can keep up with the card’s thermal output far better than any we’ve seen in the lab. In a single word, impressive!
DirectCU II Noise and Temps
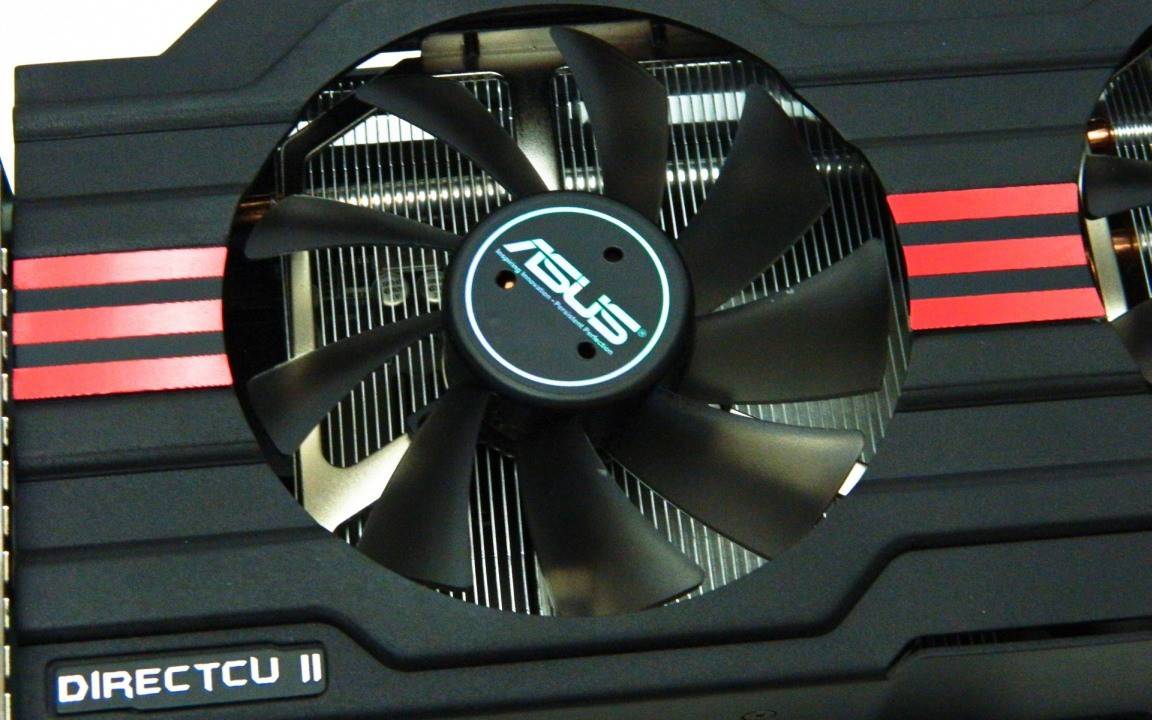
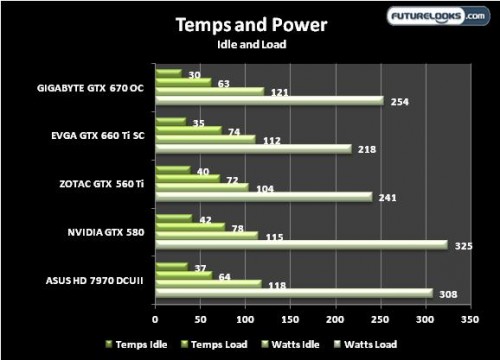
The DCUII cooler has a neat feature in auto mode. When the monitor goes in to standby and the GPU is inactive, the fans turn off. The fans create about 19dB noise when just working or browsing the web. It doesn’t get any quieter unless you manually turn down the fans. In-game noise really depends on how hard the GPU is working. Metro 2033 benchmarks resulted in 32dB where as something like Borderlands 2 created less. Finally, overclocking the card all but ensured 40dB running any game as the card is very aggressive about controlling temps. As far as high performance gaming cards go, the noise is completely expected and still very respectable.
Cooling performance is exemplary. Auto fan mode kept stock and overclocked temps under 65C which is awesome compared to the 80C reference cards. Manual mode at 75% was much louder and maybe only a degree or two cooler. This just proves that Auto mode on this card is a near perfect compromise. Overall, the DirectCU II cooler is more than up to the task.
Note: Keep in mind that decent computer cases with proper air flow will block up to 10dB of all that fan noise. In my lab scenario, the system inside an NZXT Switch 810 was up to 9dB quieter than the tech station. Some other cases with sound dampening properties like the Antec P183 will block even more. Good quality cases will help manage the potential noise and high end components will help to even mask it.
3D Benchmark Performance
Let’s get our 3D graphics on! With the exception of 3DMark11 using 720p Performance settings, the rest of the benchmarks (Heaven Demo 3.0, Metro 2033, Batman AC, Stalker CoP, Battlefield 3, and Aliens vs Predator) were all performed using 1920 x 1080p resolutions. Sample settings are noted in the graph header.
3DMark11
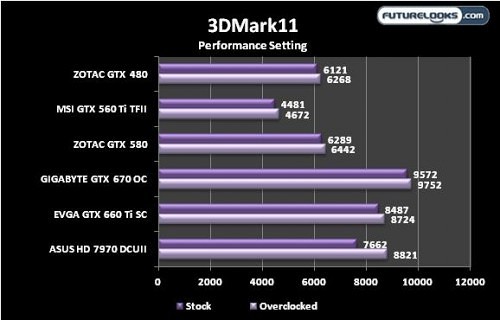
I’ve been told that 3DMark11 doesn’t always work properly on some AMD GPUs. I find it hard to believe that the score is indicative of its 3D performance. However, the score increases dramatically when the card is overclocked. Not sure it’s going to set any 3DMark11 records just yet. Still, one synthetic benchmark doesn’t mean you should sell the farm.
Heaven Demo 3.0
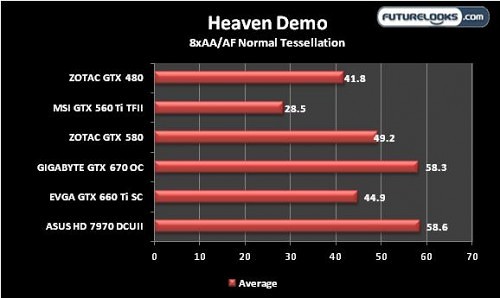
Here, performance is more along the lines of what we expect. It closes the gap on the very powerful GIGABYTE GTX 670 OC card. The ASUS driver was about 4 frames slower which isn’t much of a difference but we serious gamers demand the best results for our hard earned money.
Now let’s steer our attention towards real world gaming benchmarks and then our final thoughts.

